Tesla Financial Statement Analysis
This project involves an in-depth analysis of Tesla's financial statements using Excel. It includes vertical and horizontal analysis to examine financial trends, ratio analysis to evaluate performance metrics, and quantitative techniques such as Alpha, Beta, CAPM, and Sharpe Ratio to assess risk and return. Additionally, it features a separate charting tool that allows users to compare Tesla's performance against the Nasdaq over a desired timeframe, providing visual insights into market trends and relative performance.
Please download the file from the link below to see the entire project.
Vertical analysis of Tesla's income statement, where each line item is expressed as a percentage of total revenue, along with a ratio analysis comparing Tesla's key financial ratios for profitability, liquidity, solvency, efficiency, and valuation against industry averages. The analysis highlights trends and performance metrics over three years, providing insights into Tesla's financial health and market position.

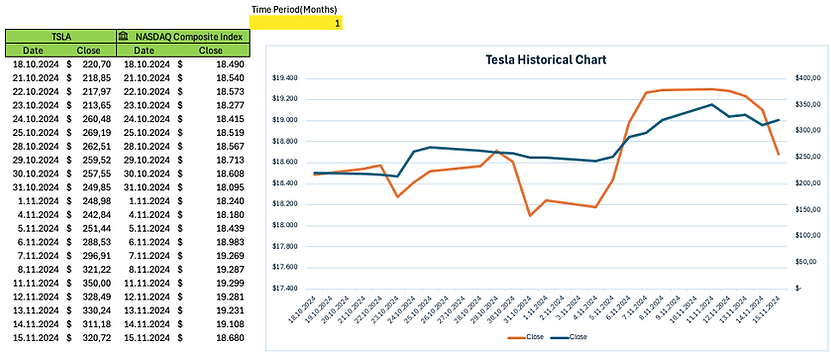
Charting tool that compares Tesla's stock price with the Nasdaq Composite Index over a selected timeframe. Users can customize the chart to display data for 1, 3, 6, or 12 months, clearly visualizing performance trends and relative movement between Tesla and the broader market index.