Buy-Sell Signals:
Bollinger Bands
The project creates buy and sell signals for the selected ticker, timeframe, and band length using Bollinger Bands.
In order to avoid the look-ahead bias, the previous 1 and 2 days have been taken into account in each data point.
The project additionally applies trailing stop-loss in which the stop-loss percentage could be determined by the user.
The strategy is as follows:
Open Long position if;
-Price crosses above the lower band
Open Short position if;
-Price crosses below the upper band
Importing required libraries:

Getting historical data and calculating Bollinger Bands:

Defining buy and sell conditions:

Adding stop-loss and trailing stop-loss:

Defining a function to plot the chart and signals:
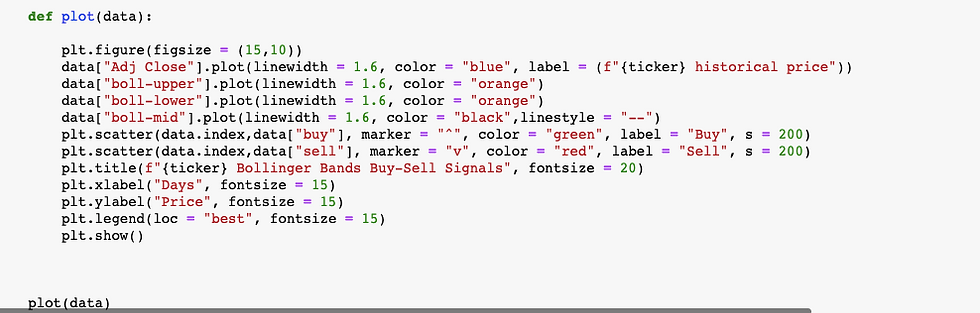
Final output where the price chart, Bollinger Bands, and buy-sell signals are plotted:
Ticker, timeframe, time interval, band_length, standard deviation, and stop-loss percentage could be changed as desired.
